 EzUnit — Easing the Debugging of Unit Test Failures
EzUnit — Easing the Debugging of Unit Test Failures
EzUnit — Easing the Debugging of Unit Test Failures
Note: This page describes EzUnit Version 5, which is very different from the original version, EzUnit Version 1, and the last version, EzUnit Version 4.
to link JUnit test failures to locations in source code; to report logical errors analogously to compiler-generated errors and warnings
When the Eclipse compiler discovers an error (syntax error or semantic, i.e., typing, error), the IDE displays a description of the error (text associated with violated compiler rule) and the source location where it is assumed to have occured in the Problems View, allowing direct navigation to the (most likely) cause of the error. By contrast, when JUnit discovers a unit test failure (indicating a logical error in the program), it displays the name of the failed test case, leaving the task of localizing the cause of the failure to the programmer. EzUnit is a framework that offers an extension point for so called fault locators, methods to predict locations of logical errors in source code based on information gathered from the tested program and its test cases.
Given a Java project with JUnit tests that fail,
Important note
Make sure that the tests and the code that shall be tested are not situated in the same package, because EzUnit won't work correctly if that is the case.
Select "Window > Show View > Other... > EzUnit > EzUnit Result" to open EzUnit's Result View, which will look like this:
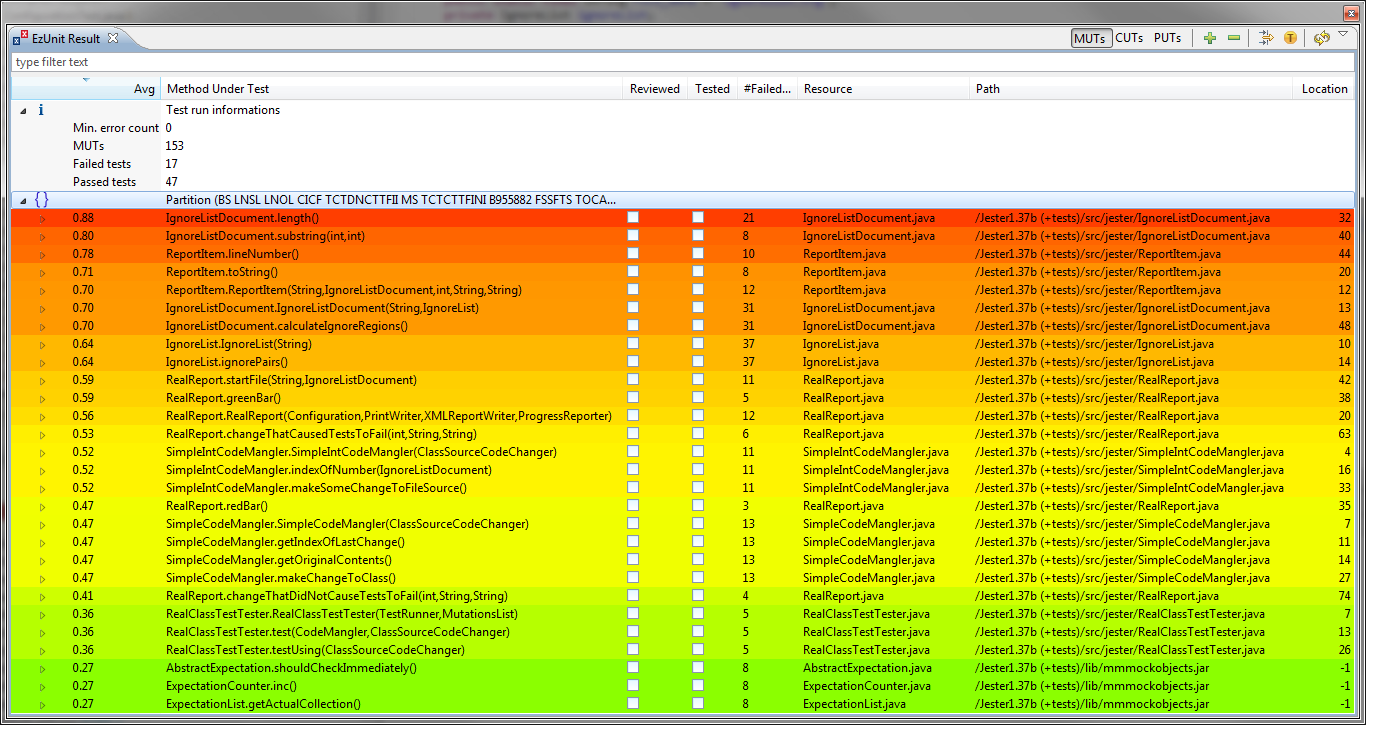
Potentially faulty source locations (methods) are displayed, ranked according to their computed likelihood of failure.
By double-clicking on an entry, the corresponding source location is shown in the editor (a location of -1 indicates a missing concrete source position, e.g. for methods in .class or .jar files or implicit constructors).
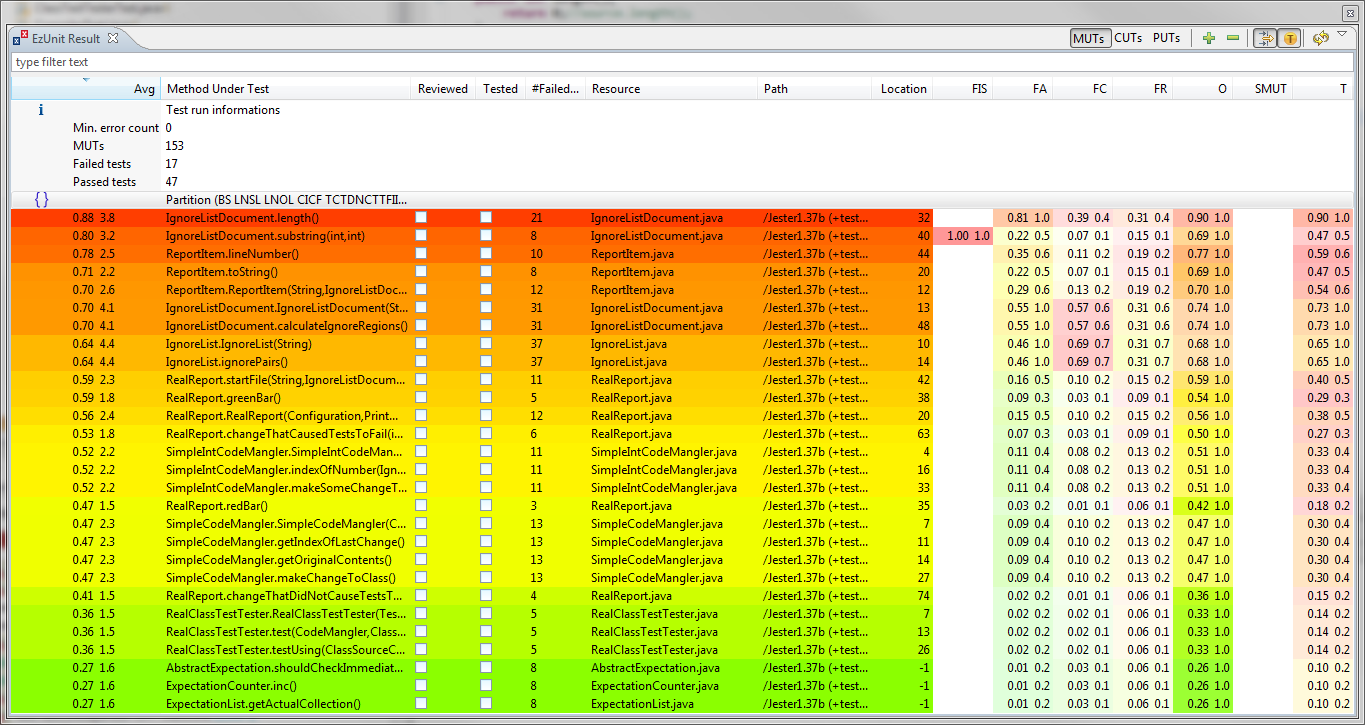
The results of each individual fault locator can be obtained by clicking the yellow (T) in the tab pane (right; see above), leading to the following view:
Select "Window > Show View > Other... > EzUnit > EzUnit Matrix" to open EzUnit's Matrix View, which will look like this (for the same data as the examples above):
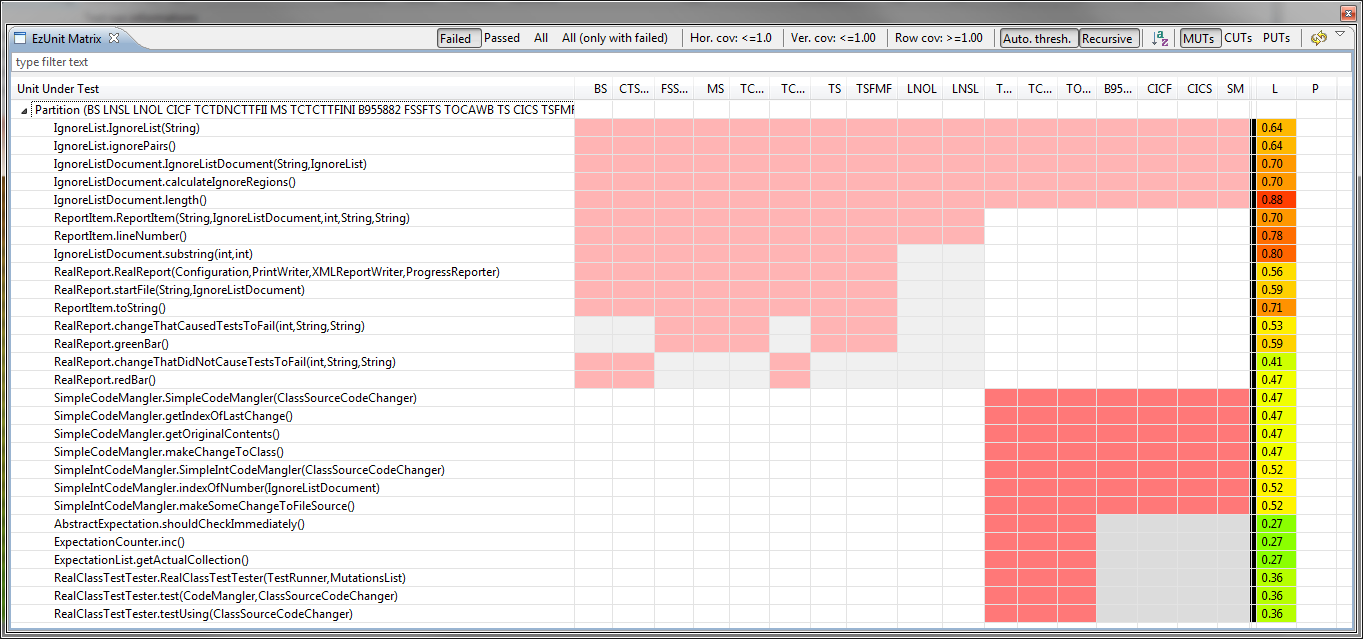
The EzUnit Matrix View will show the test coverage matrix (TCM) for the executed test cases.
A TCM consists of all or certain subset of tests as columns and all called units of the test run as rows (UUTs - Units Under Test), where each test case is connected to the units it calls (directly or indirectly) via a colored cell.
The rows and columns are divided into partitions with each partition forming a distinct subset of all units and considered tests; the ranking of methods by the fault locators will be done for each partition separately as if there where no other partitions.
Subsets of considered tests might contain either only all failed tests, only all passed tests, all tests or all tests again, but only partitions containing failed tests; the desired subset can be defined with the appropriate button above the matrix.
A unit might be a method, a class or a whole package, depending on the chosen granularity (which can be changed with the buttons in the upper right corner of the window).
The test cases and units are sorted in a way that they form a structure of distinct blocks, connected only by a few rows (the 5 top rows in the example above).
Each block will be subdivided recursively into further blocks, until no more blocks can be found. The details of the block structure can be altered with the remaining options above the matrix (a description of their functionality will follow soon, along with a description of the block finding algorithm)
The EzUnit Matrix View is suitable to find faults in a program in situations, where more than one fault is present and the faults cannot be assigned to different partitions.
Consider the following Result View of an example with faults in the methods "SimpleIntCodeMangler.makeSomeChangeToFileSource", "TwoStringSwappingCodeMangler.makeSomeChangeToFileSource" and "ReportItem.lineNumber":
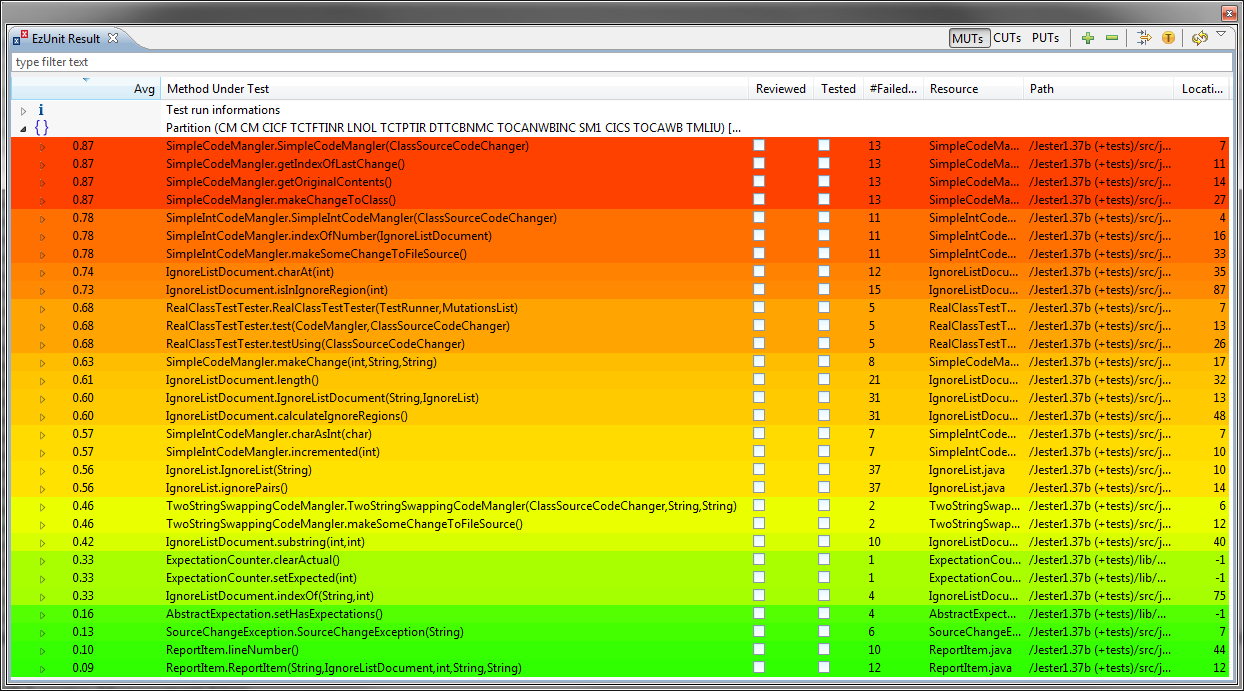
As can be seen, the faults units have a relatively low ranking (especially ReportItem.lineNumber).
The first fault might be found after 7 inspected methods, but there is no evidence for further faults, so re-running the test runs is required to search for more faults.
The Matrix View to the very same situation looks as follows:
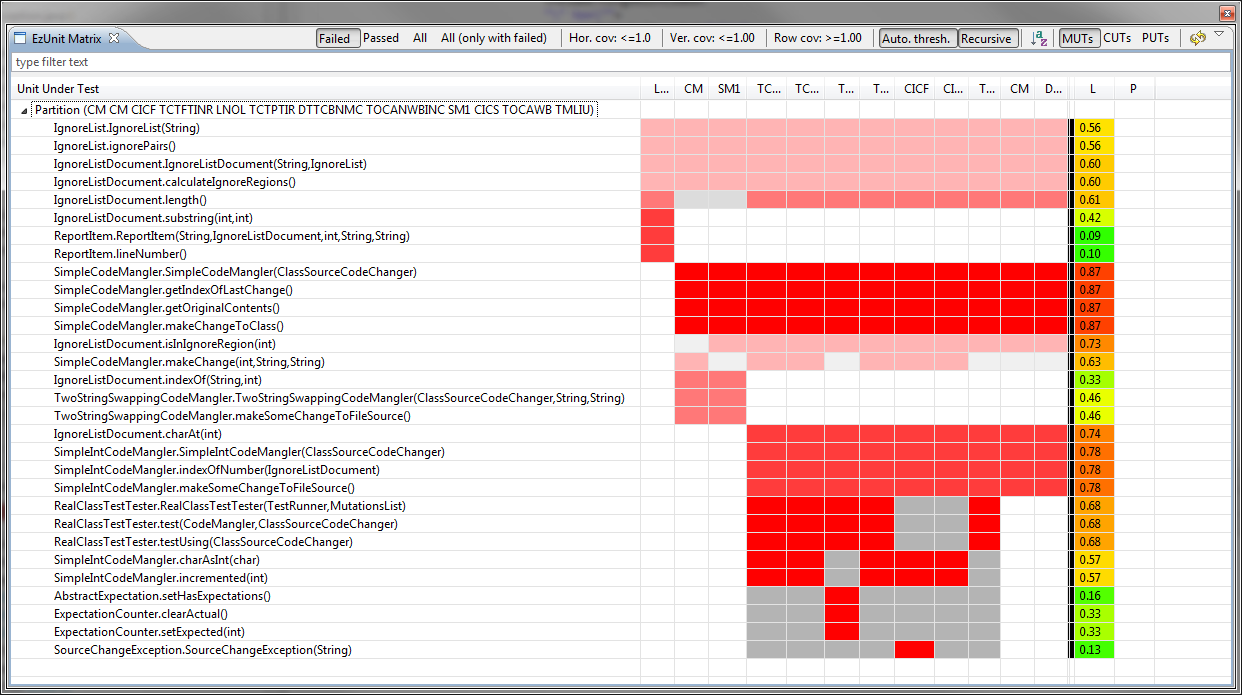
The relatively low ranking of the top units indicates the presence of more than one fault (although that does not necessarily have to be the case).
The key to search for more than one fault is marking inspected units as "reviewed" if they are probably without a fault; to mark a unit as "reviewed", right click it in the Matrix View and choose "Mark UUT as reviewed".
[The reviewed status will also be shown in the Result View, indicated by the check box. Additionally, a UUT can be marked as "tested", an even a stronger indication for faultlessness, which will propagate to all methods called by the marked method.]
Assuming that the first 5 UUTs habe been reviewed and considered as correct, a new partition can (and will automatically) be done, resultung in the following view:
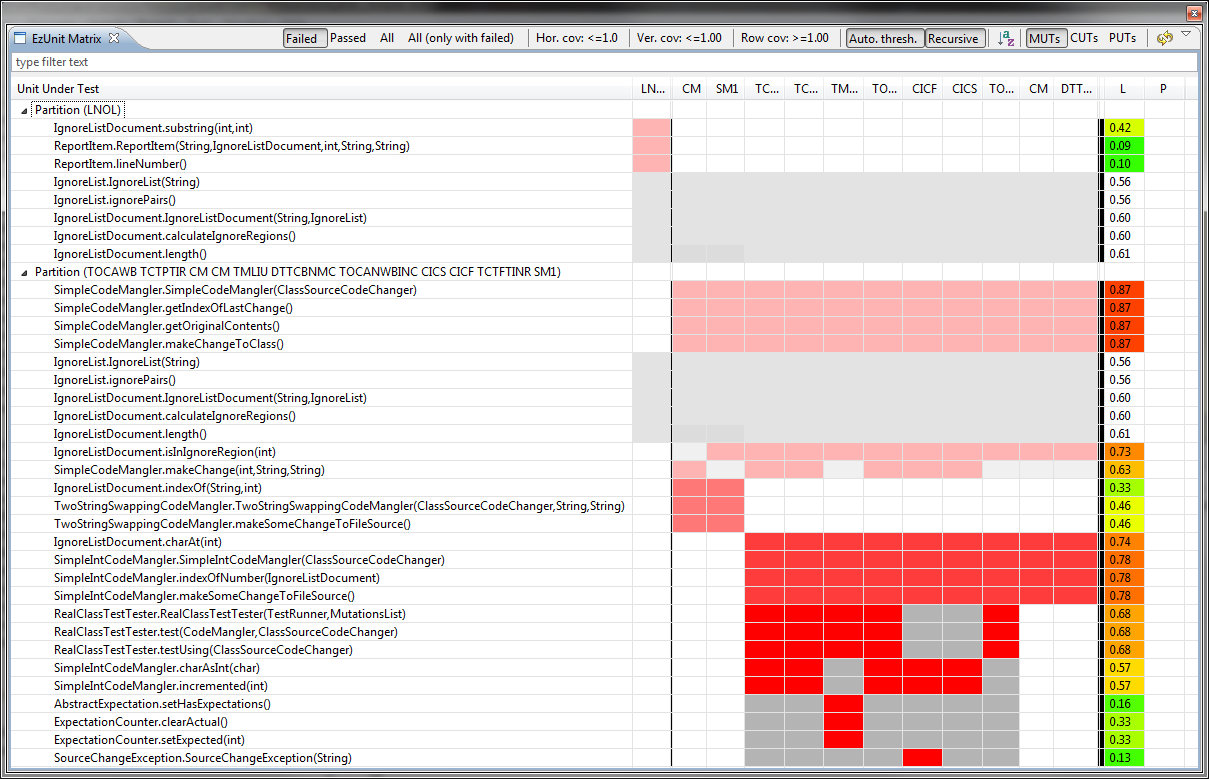
Two distinct partitions indicate, that there are at least two faults to be found in the program.
Marking some more UUTs in the second partition as being fault-free will lead to an even further partitioning:
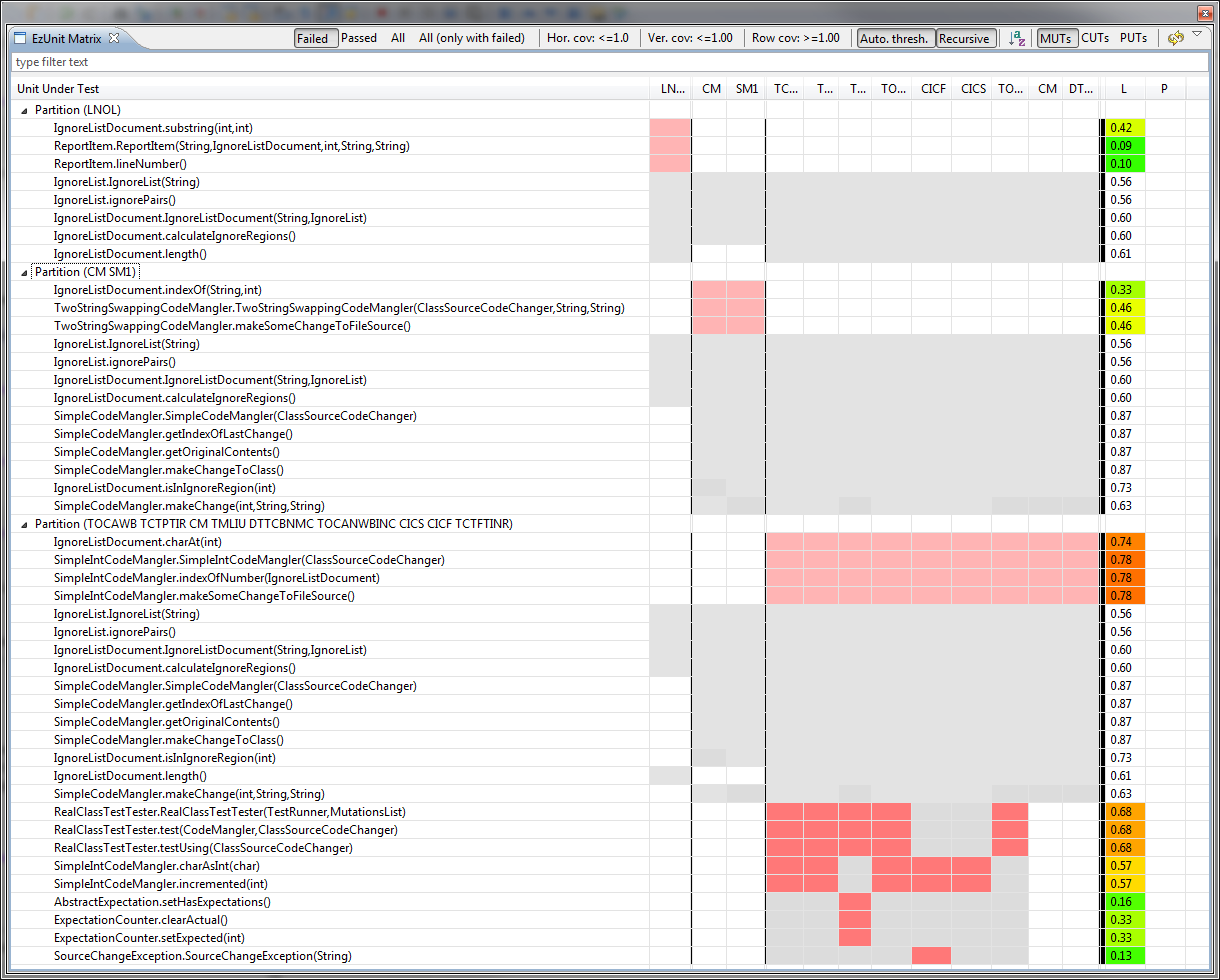
Now it is possible to search for at least three faults in parallel, meaning that they might be searched by three persons independently from each other; but more importantly they can be searched without re-running the test cases after finding one of the errors.
Not all present fault locators need be queried for fault localization, and not all queried fault locators need be given the same weight.
Select "Window > Show View > Other... > EzUnit > Fault Locator Management" to activate, deactivate, and configure fault locators.
Select "Window > Show View > Other... > General > Properties" to show additional fault locator properties for configuration.
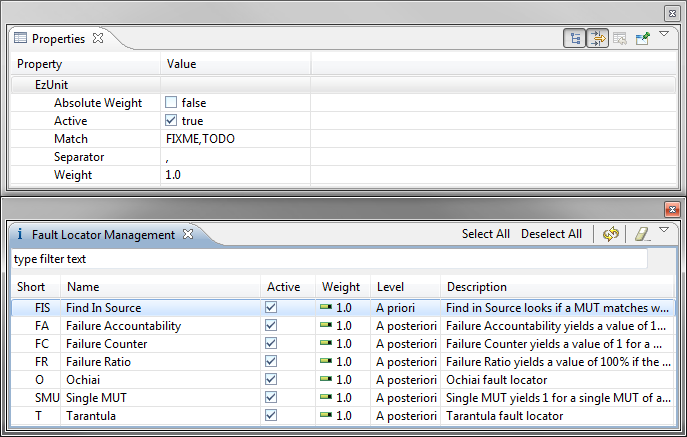
The Weigth column specifies the given linear weight of the fault locator relative to the others.
Inactive fault locators (either with a not checked "Active" box or with a weight of 0) are not considered.
Note that certain fault locators are capable of computing their own, individual weight (based on the strength of the evidence they rely on), which is combined with the given weight.
The possible fault locations are usually restricted to methods called by one or more failed unit tests.
To get a quick overview of all methods called by a test case, EzUnit provides an optional call graph view; it requires the prior installation of Zest (see Installation).
Select "Window > Show View > Other... > EzUnit > Call Graph" to see the call graph of a test case selected.
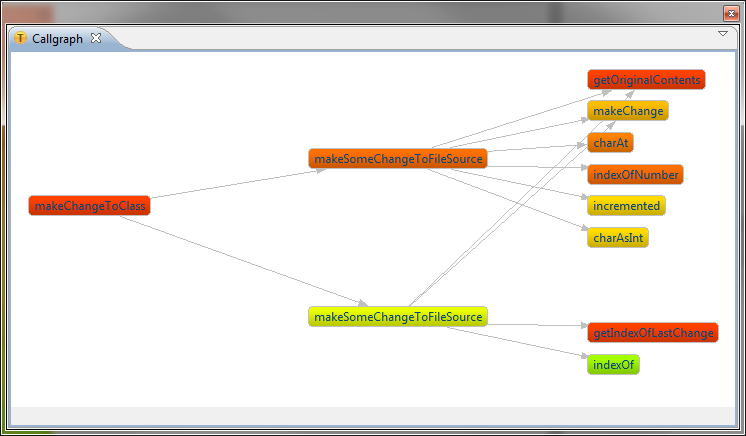
Double clicking opens the corresponding method in the editor.
To constrain the possible fault locations to code from selected sources, open the preferences/properties page:
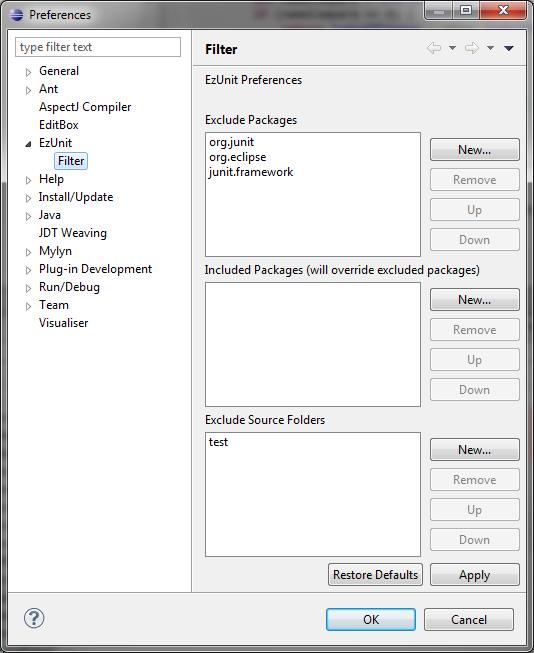
Each resource listed in one of the "Exclude" lists and all of its sub-resources will be ignored by the ranking and the block building algorithms.
However, if a particular sub-resource should be included, it can be listed in the corresponding list.
[The parent menu of the shown properties menu should be ignored for now.]
EzUnit does not rely on a fixed set of fault locators — rather, it provides an extension point for including as many different fault locators as desired.
The result of each activated fault locator is combined with that of the others to provide a joint error diagnosis.
The following list of fault locator plugins is included with the standard update of EzUnit:
New fault locators can be added by writing a new fault locator plugin for the extension point "org.projectory.ezunit.core.faultLocator" provided by EzUnit and copying it into Eclipse's plugin directory.
To collect information from test execution, EzUnit uses the open source Java profiler JIP. It is automatically installed when installing EzUnit.
EzUnit configures JIP to trace the execution of every test case (currently only the methods called) and to report the trace to the EzUnit plugin.
For the installation of EzUnit, use its update site http://www.fernuni-hagen.de/ps/prjs/EzUnit5/update/.
Work on fault location is currently prospering. Tarantula is perhaps the best know fault locator tool. However, it is a standalone tool and currently available only for C source code.